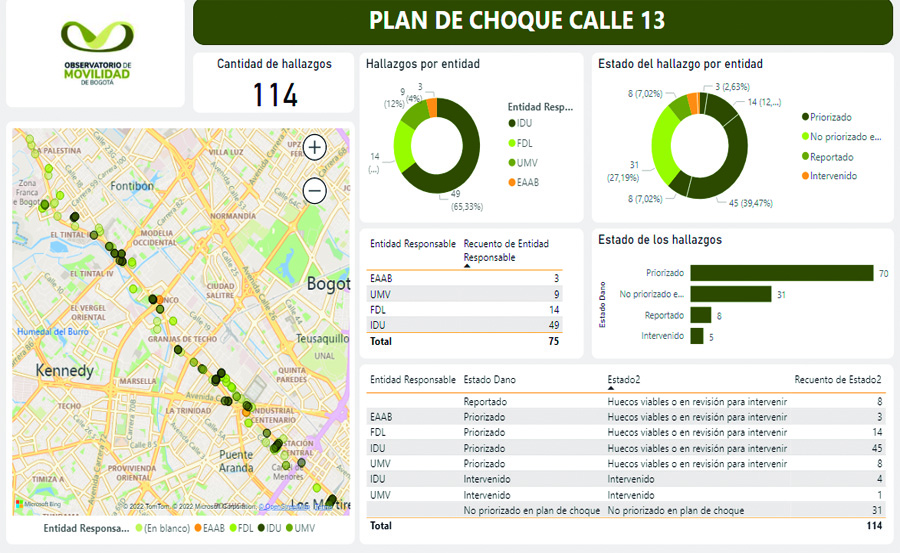
BOGOTÁ MOVILITY DATA VIS
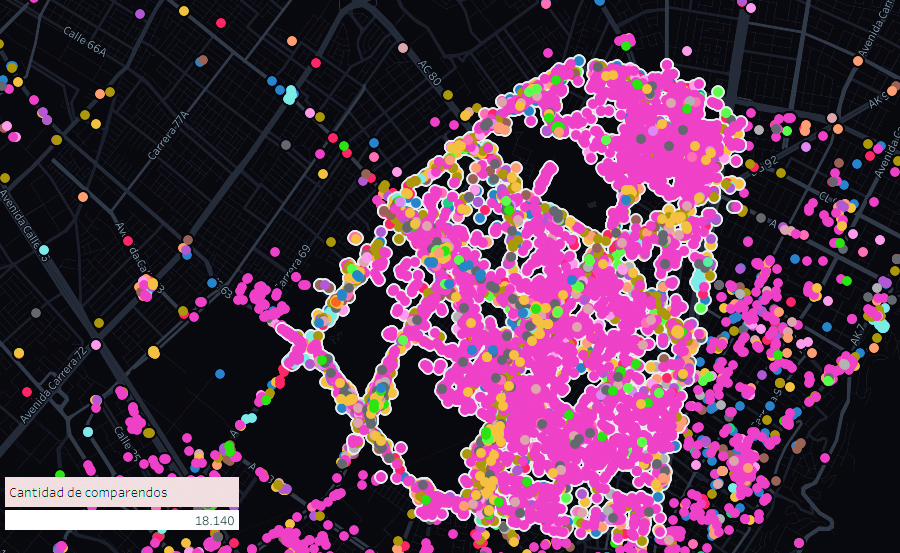
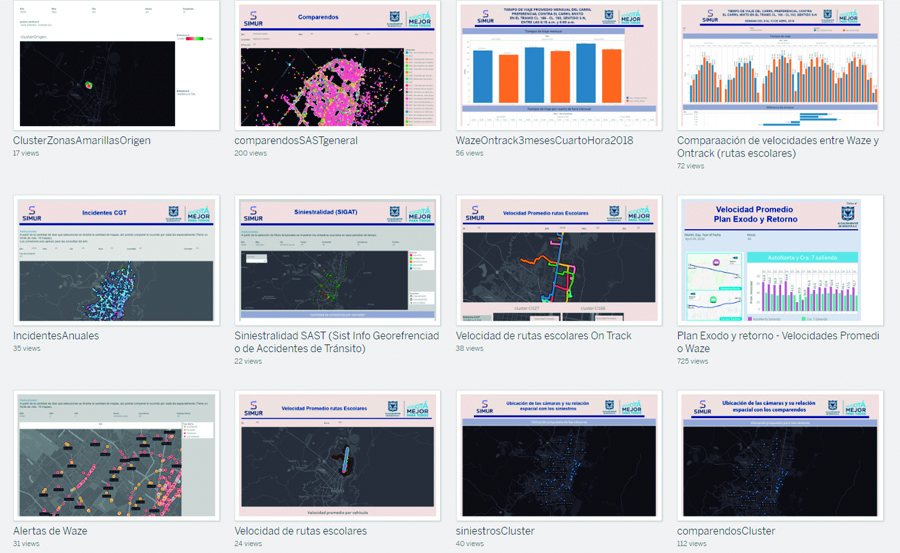
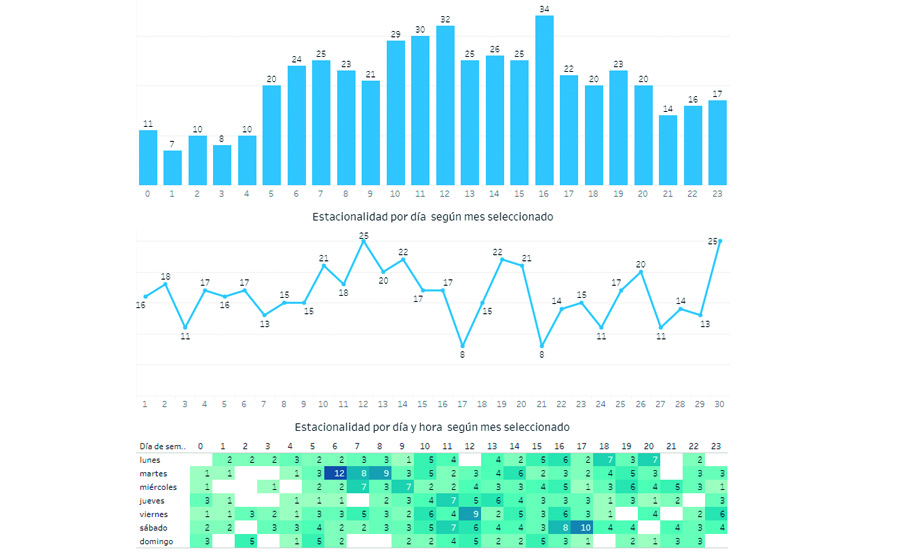
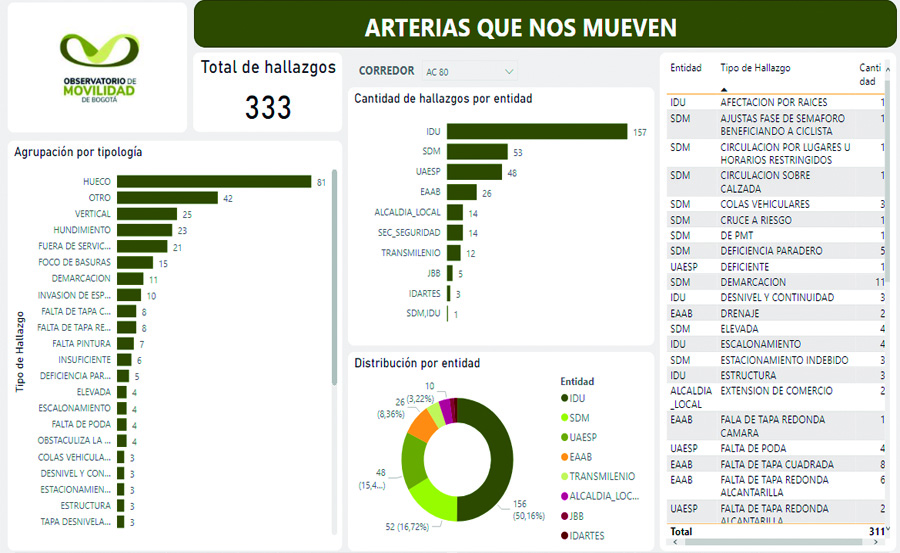
Charts and graphs with Tableau and Power BI using Bogotá movility data, which was processed, filtered and normalized to analize the information of velocity, accident rate, transit infractions, taxis data, public transport data and others. The boards were creating to analize and follow the principal rates of the Planning Movility Department in the District Secretary Mobility Of Bogotá.