ENTRANCE TRANSMILENIO STATIONS
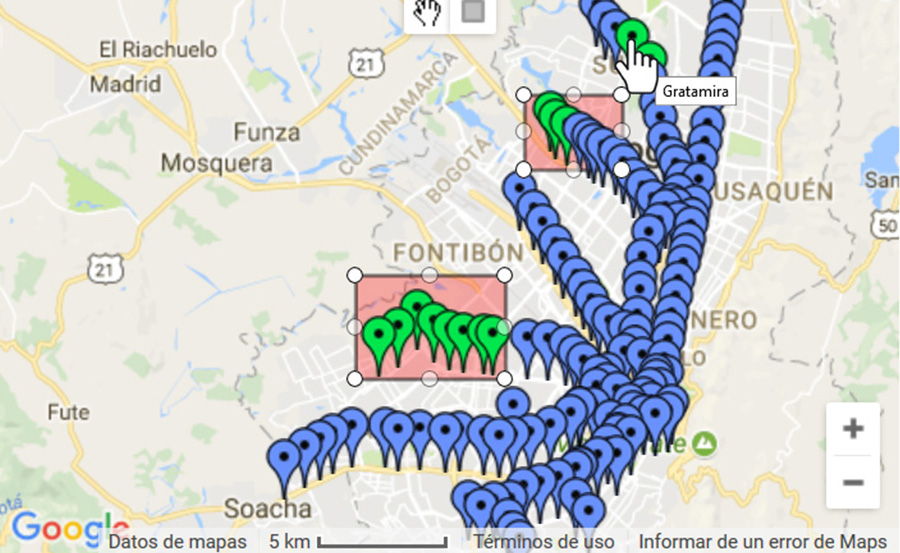
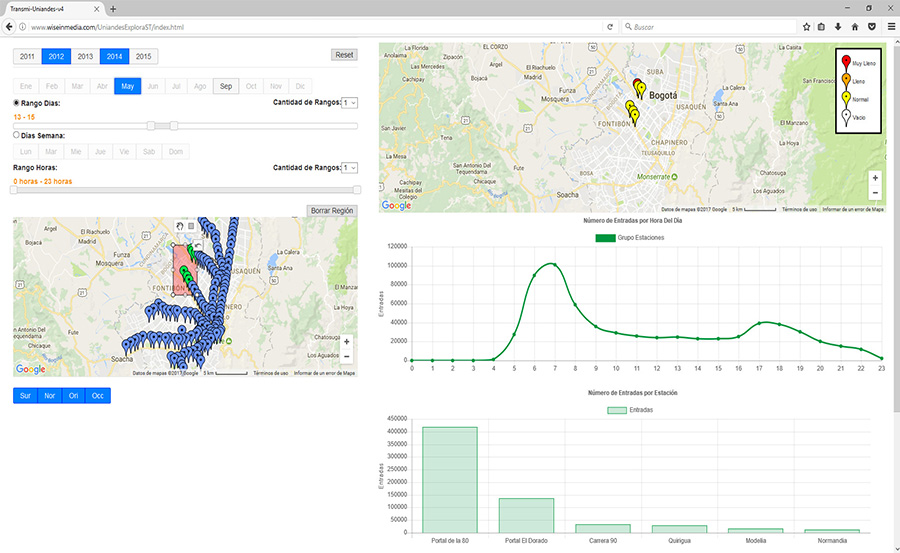
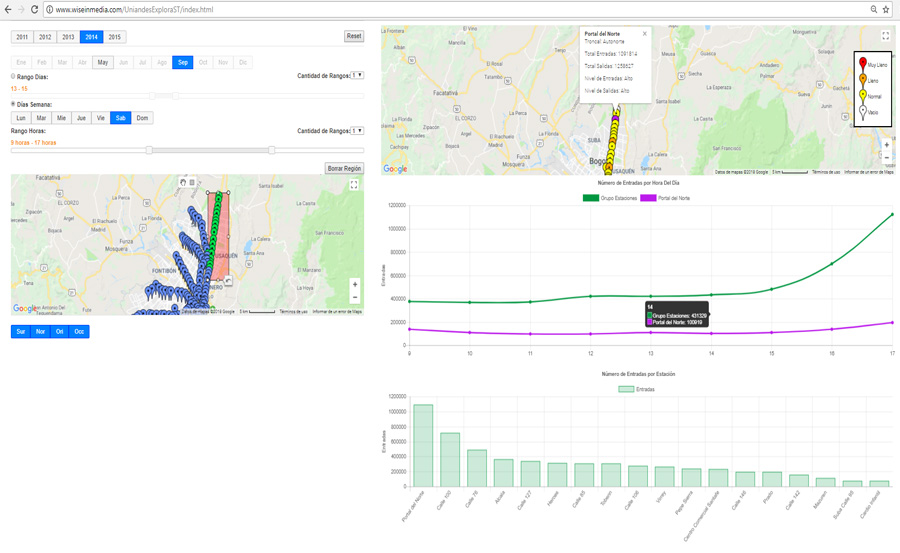
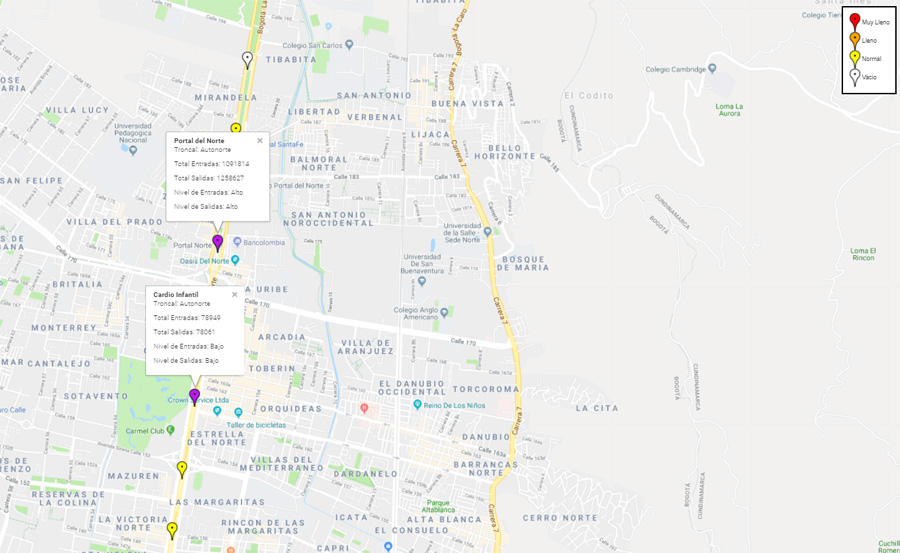
Application developed in .js using webworkers to filter and organize Transmilenio Stations data depend of the spatial (location stations), temporal (years, months, days, hours) or attributes (entrance north, south, west, east of the station) selected by the user to visualize the data of each station and splots to analize the information.